

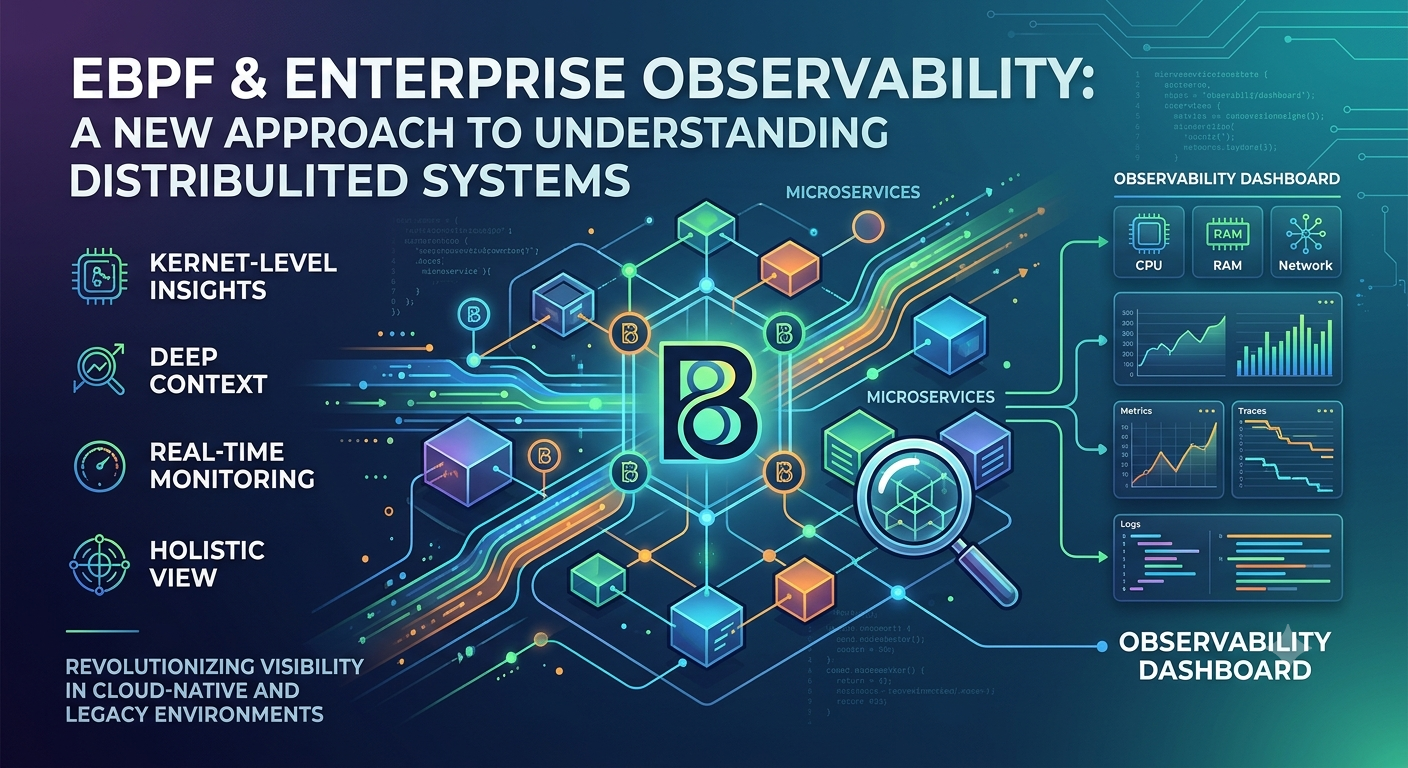


Modern enterprise applications rarely operate as isolated systems. A single customer request may pass through an API gateway, several microservices, distributed databases, containerized workloads, and cloud infrastructure before returning a response. When something goes wrong, identifying the root cause can be difficult because each component produces different logs, metrics, and traces. Traditional monitoring tools provide valuable information, but they do not always reveal what is happening deep inside the operating system or how infrastructure behavior affects application performance.
This is where eBPF and enterprise observability are changing the way organizations understand distributed systems. Extended Berkeley Packet Filter (eBPF) is a Linux kernel technology that allows programs to run in a controlled environment at supported instrumentation points. It enables organizations to collect detailed runtime information about networking, system calls, process activity, and application behavior without requiring extensive changes to application code.
By combining eBPF-based instrumentation with traditional observability platforms, enterprises can gain deeper visibility into their infrastructure, investigate performance bottlenecks, improve security monitoring, and reduce the time required to diagnose complex failures. As organizations adopt Kubernetes, microservices, hybrid cloud architectures, and increasingly dynamic workloads, eBPF is becoming an important part of the modern observability toolkit.
What Is eBPF?
eBPF is a technology that enables programs to execute within the Linux kernel under a set of safety checks and runtime constraints. Originally associated with packet filtering, it has evolved into a flexible mechanism for observing and influencing selected system behaviors.
Instead of requiring organizations to modify every application to expose additional diagnostic information, eBPF can attach programs to supported kernel events and other instrumentation points. These may include tracepoints, system calls, process execution, file activity, scheduling behavior, and networking events. Depending on the program and instrumentation method, eBPF can collect data, filter events, maintain counters, or apply narrowly scoped actions.
A key advantage is that eBPF programs are verified before execution, helping prevent unsafe operations. They also run under kernel-enforced constraints, although verification does not eliminate every security, compatibility, or operational risk. Organizations still need to manage program privileges, kernel compatibility, resource consumption, and the trustworthiness of the tooling they deploy.
In observability environments, eBPF commonly acts as a data collection layer. Specialized agents use it to observe system behavior, summarize events, and send relevant telemetry to monitoring platforms. This approach can reduce the need for invasive instrumentation while providing information that conventional application-level monitoring may miss.
Why Traditional Observability Struggles With Distributed Systems –
Traditional observability relies on three commonly used signals: metrics, logs, and distributed traces. Metrics describe system behavior over time, logs record specific events, and traces help reconstruct the journey of a request across services.
These signals remain essential, but collecting them consistently across a large distributed environment introduces several challenges.
1. Instrumentation Is Difficult to Maintain –
Application-level instrumentation often requires libraries, agents, configuration changes, or code modifications. When an organization operates hundreds of services written in different languages, maintaining consistent instrumentation becomes a substantial engineering task.
Some applications may expose rich telemetry, while others provide only basic logs and metrics. Third-party services and legacy applications can be particularly difficult to instrument because teams may not control their source code.
eBPF can help fill some of these gaps by collecting selected runtime information independently of application-language instrumentation. However, it does not automatically reconstruct every business transaction or reveal application-level meaning without additional context.
2. Network Problems Can Be Difficult to Localize –
A slow request might originate from application processing, DNS resolution, TCP retransmissions, connection setup, a congested network path, or a downstream dependency. Application dashboards may show increased latency without explaining where the delay occurred.
eBPF-based network observability can capture selected connection-level and packet-related information, depending on the collection method. This helps teams investigate connection failures, retransmissions, unexpected traffic patterns, and communication between services.
The additional visibility can narrow the investigation from a general performance problem to a more specific network or infrastructure issue.
3. Telemetry Volume Can Become Expensive –
Large enterprises generate enormous quantities of observability data. Collecting every event, retaining it indefinitely, and indexing it for searches can increase storage, processing, and licensing costs.
eBPF tools can filter events and aggregate information closer to the source before forwarding it. For example, an agent may produce connection summaries or latency distributions instead of exporting every low-level event.
This can improve efficiency, but the savings depend on the implementation. High-cardinality labels, excessive event capture, and poorly designed telemetry pipelines can still create significant overhead and cost.
How eBPF Works in Enterprise Observability –
eBPF-based observability generally follows a pipeline that connects kernel instrumentation with higher-level monitoring systems.
The eBPF observability workflow:
- Application and infrastructure activity: Processes, system calls, networking, containers, and kernel events generate activity.
- eBPF instrumentation: Programs attach to supported tracepoints, kernel functions, user-space functions, or networking hooks.
- Collection and processing: An agent collects selected events, filters unnecessary information, aggregates measurements, and enriches the data.
- Telemetry correlation: The collected information is associated with relevant process, container, host, and service metadata where possible.
- Observability platform: Dashboards, alerts, traces, and investigation tools help engineers identify performance problems and potential security issues.
Step 1: Attach to Relevant Events –
An eBPF program is attached to an appropriate instrumentation point. Tracepoints expose defined kernel events, kprobes can instrument selected kernel functions, and uprobes can instrument selected user-space functions. Networking programs can attach to supported network hooks to observe or process traffic.
The best attachment point depends on the diagnostic question. For example, investigating process scheduling delays requires different instrumentation from analyzing TCP connection behavior.
Step 2: Collect and Summarize Runtime Information –
When a relevant event occurs, the eBPF program executes within the kernel’s constrained environment. It may collect timestamps, process identifiers, connection metadata, counters, or other permitted information.
Many implementations use eBPF maps to maintain state or aggregate measurements. Ring buffers or other supported mechanisms can transfer selected events to a user-space agent, where they can be enriched and exported.
Step 3: Correlate Infrastructure Data With Applications –
Raw kernel events do not necessarily identify a customer transaction, business operation, or meaningful application error. The user-space collection layer and observability platform must connect low-level data with relevant context, such as process identity, container metadata, service names, and trace identifiers where available.
This correlation is especially important in distributed environments. A network delay becomes much more actionable when an engineer can connect it to a specific service dependency and a corresponding increase in request latency.
Step 4: Turn Telemetry Into Actionable Insights –
The resulting data can support dashboards, anomaly detection, alerting, performance investigations, and security analytics. Engineers can use it to investigate where latency occurs, identify abnormal system behavior, and distinguish application problems from infrastructure issues.
The value comes not from collecting the maximum possible data but from collecting the right information and making it useful to the people responsible for reliability and security.
Key Enterprise Use Cases for eBPF –
1. Distributed Application Performance Monitoring –
In a microservices environment, application performance depends on interactions between services, operating-system behavior, and network communication. Traditional traces may show that a request is slow without fully explaining the infrastructure events contributing to that delay.
eBPF-based instrumentation can provide additional information about process execution, scheduling, network connections, and selected system calls. When correlated with application traces, this information can help engineers determine whether latency is associated with CPU scheduling, connection establishment, network retransmissions, or other observable system-level behavior.
For example, an e-commerce platform may experience intermittent delays during peak traffic. Distributed traces identify a slow checkout request, while eBPF telemetry reveals elevated connection latency between the checkout service and a downstream dependency. Engineers can then investigate the affected communication path instead of making broad, potentially unnecessary application changes.
2. Kubernetes and Container Observability –
Kubernetes environments are dynamic. Containers are created and removed frequently, workloads move between nodes, and service relationships change as deployments evolve. Monitoring tools must therefore maintain accurate context as infrastructure changes.
eBPF can observe selected activity on Kubernetes worker nodes and provide visibility into network flows, process behavior, and container-related events. Depending on the implementation, it can help identify unexpected service communication, connection failures, and workload-level performance problems.
This is particularly useful when teams need to understand interactions across pods, namespaces, nodes, and services. However, eBPF is not a replacement for Kubernetes-native metrics, orchestration events, or application telemetry. Its greatest value comes from combining low-level runtime visibility with orchestration metadata and application context.
3. Network Observability and Service Communication –
Network performance problems can appear as application failures even when the application code itself is functioning correctly. Connection resets, retransmissions, connection delays, and unusual traffic patterns can affect response times and service reliability.
eBPF-based network tools can collect selected information about these behaviors and provide visibility into communication between workloads. This can help teams investigate service-to-service dependencies, detect communication bottlenecks, and understand how network activity changes during incidents.
Some eBPF-based platforms also use kernel networking hooks to implement functions associated with traffic processing, load balancing, or network policy enforcement. These are related but distinct from passive observability: organizations should evaluate the operational and security implications of any component that actively changes traffic behavior.
4. Cloud Security and Runtime Threat Detection –
Observability and security often depend on the same underlying evidence. Unexpected process execution, unusual outbound connections, suspicious file access, and abnormal privilege-related activity can indicate potential security issues.
eBPF-based runtime security tools can monitor selected system events and use behavioral rules to identify suspicious activity. For example, a container that unexpectedly launches a shell or establishes a connection to an unusual destination may warrant investigation.
This visibility can complement endpoint detection, cloud security monitoring, and centralized security information and event management (SIEM) platforms. However, eBPF telemetry alone does not establish malicious intent. Security teams need contextual analysis, validated detection rules, and appropriate response procedures to reduce false positives and avoid disrupting legitimate workloads.
5. Capacity Planning and Resource Optimization –
Infrastructure teams need to understand how workloads consume CPU, memory, storage, and network resources. Standard utilization metrics reveal broad trends, but they may not explain why a workload is underperforming despite apparently healthy resource levels.
eBPF can help expose selected scheduling behavior, system calls, and resource-related activity. This can support investigations into CPU contention, excessive system-call activity, and performance differences between workloads.
When combined with application performance data and infrastructure metrics, these insights can inform capacity planning and resource allocation. Teams should nevertheless validate whether observed behavior is representative and whether changes improve service-level objectives rather than optimizing a low-level metric in isolation.
eBPF vs. Traditional Observability: Understanding the Difference –
eBPF is not a complete replacement for existing observability technologies. It adds a distinct source of runtime information that can complement application instrumentation, infrastructure monitoring, and distributed tracing.
| Capability | Traditional Observability | eBPF-Based Observability |
|---|---|---|
| Primary data sources | Application instrumentation, logs, metrics, traces, and infrastructure agents | Selected kernel events and supported user-space instrumentation points |
| Application code changes | Often needed for detailed application tracing | May be unnecessary for selected system-level insights |
| System-level visibility | Depends on agents and available operating-system metrics | Can provide deeper visibility into selected runtime and kernel events |
| Network diagnostics | Varies by platform and instrumentation | Can provide detailed connection and network-event visibility |
| Business context | Often available through application instrumentation | Usually requires correlation with application and service metadata |
| Deployment complexity | Varies by agent, SDK, and platform | Requires compatible kernels, privileges, agents, and instrumentation management |
| Resource considerations | Depends on telemetry volume and instrumentation | Depends on probes, event volume, processing, and implementation |
| Best suited for | Application behavior, business transactions, service metrics, and end-to-end traces | System-level diagnostics, network visibility, runtime insights, and complementary security telemetry |
The practical difference is one of perspective. Traditional instrumentation often provides the meaning of an operation, such as a failed payment or a slow database query. eBPF can provide additional evidence about what the operating system and network were doing around that operation.
Used together, these approaches can produce a more complete view of distributed applications.
Benefits of eBPF for Enterprise IT Operations –
- Reduced Instrumentation Overhead
For selected use cases, eBPF can provide valuable telemetry without requiring teams to modify every application. This is particularly useful for legacy workloads, third-party applications, and environments where code-level instrumentation is difficult to maintain.
It does not eliminate the need for application instrumentation in every case. Business transactions, custom application attributes, and precise semantic context may still require code-level tracing or supported application agents.
- Faster Root-Cause Analysis
Engineers can combine application traces with operating-system and network information to narrow the search for the source of an incident. Instead of investigating every service equally, teams can focus on the layer showing evidence of abnormal behavior.
This can improve mean time to resolution (MTTR), provided the telemetry is well correlated, alerts are actionable, and operational teams know how to interpret the results.
- Better Visibility Across Heterogeneous Environments
Large organizations often operate different programming languages, runtimes, container platforms, and infrastructure environments. eBPF can provide a more consistent source of selected system-level signals across supported Linux workloads.
Coverage is not universal. Available events, hooks, and capabilities vary by kernel version, distribution, architecture, runtime, and implementation. Organizations should validate coverage before assuming the same instrumentation will work identically across all environments.
- More Efficient Telemetry Collection
Some eBPF implementations filter or aggregate events before exporting them to central platforms. This can reduce unnecessary data transfer and downstream processing.
The efficiency gains depend on the design of the telemetry pipeline. Collecting excessive high-cardinality information or exporting every low-level event can still increase costs and affect performance.
Challenges and Limitations of eBPF Adoption –
Despite its advantages, eBPF introduces technical and operational considerations that enterprise teams must address before deploying it widely.
Kernel compatibility and portability: eBPF capabilities depend on kernel support and the instrumentation methods used. Features available on one Linux distribution or kernel version may not be available in another environment. Tools that use Compile Once – Run Everywhere (CO-RE) techniques and BTF metadata can improve portability, but they do not guarantee universal compatibility.
Security and privileges: Some eBPF operations require elevated privileges or specific capabilities. Agents should be deployed with the minimum permissions necessary, and organizations should review the trustworthiness of the software, its update process, and its potential impact on production workloads.
Performance overhead: Although eBPF can be efficient, it is not cost-free. Probe frequency, event volume, processing complexity, and export behavior can consume CPU and memory. Teams should benchmark representative workloads and monitor the effect of instrumentation under peak conditions.
Data privacy and sensitivity: Runtime telemetry can contain process arguments, file paths, network metadata, or other information that reveals sensitive operational or personal details. Data collection should follow least-privilege principles, data minimization, access controls, and appropriate retention.
Skills and operational complexity: Teams need to understand kernel behavior, Linux performance, observability pipelines, and the limitations of the chosen instrumentation. Without clear ownership and documentation, eBPF can introduce another isolated monitoring layer rather than improving the existing system.
These challenges are manageable when adoption is deliberate, risk-based, and supported by operational standards.
How to Implement eBPF in an Enterprise Observability Strategy –
A successful implementation begins with a defined problem rather than a broad mandate to deploy eBPF everywhere.
Step 1: Identify the Observability Gaps –
Start by examining recurring incidents, blind spots, and time-consuming investigations. Are engineers struggling to explain network latency between services? Are containers failing without enough runtime context? Are legacy applications difficult to instrument?
Prioritize the problems where system-level evidence could materially improve diagnosis or security monitoring. Define success measures, such as reduced investigation time, improved visibility into service dependencies, or fewer unresolved incidents.
Step 2: Evaluate the Existing Technology Stack –
Review the current monitoring platform, distributed tracing implementation, logging pipeline, Kubernetes environment, Linux kernel versions, and security controls. Determine whether the chosen eBPF tooling integrates with existing telemetry formats and operational workflows.
Avoid introducing a separate data silo when existing platforms can consume the resulting metrics, logs, or traces. Integration should preserve relevant metadata and make it possible for engineers to move from an alert to the supporting evidence.
Step 3: Run a Controlled Pilot –
Select a small group of representative services or Linux hosts. Deploy eBPF instrumentation for one or two clearly defined use cases, such as network latency analysis or container runtime visibility.
Measure the quality of the collected data, the usefulness of its correlation with existing traces, resource consumption, operational overhead, and compatibility across the target environment. Test the system under normal and high-load conditions before expanding the deployment.
Step 4: Establish Security and Governance Controls –
Define who can deploy instrumentation, which kernel events can be collected, what privileges are required, and where telemetry is stored. Review access permissions, data retention, sensitive fields, and the process for updating or removing agents.
Document supported environments and define how compatibility failures, agent errors, and unexpected resource consumption will be handled. Security teams should also evaluate whether any eBPF component actively modifies traffic or system behavior rather than only observing it.
Step 5: Integrate With Existing Observability Workflows –
Connect eBPF-derived telemetry to dashboards, alerting, incident-management procedures, and distributed traces where practical. Use consistent service naming, environment labels, and resource metadata so that teams can interpret results across tools.
Establish clear operational runbooks. For example, a latency alert might direct engineers to examine request traces, service connection metrics, and relevant system-level events before escalating to the network or platform team.
Step 6: Expand Based on Measured Value –
Scale the implementation only after the pilot demonstrates practical value. Roll out in phases, validate performance and security controls, and review whether the added telemetry changes incident outcomes.
Track ongoing resource consumption, telemetry costs, compatibility issues, and the percentage of important workloads with useful coverage. Remove redundant instrumentation and refine collection rules as the environment evolves.
The Future of eBPF and Enterprise Observability –
As distributed applications become more dynamic, observability is moving beyond static infrastructure metrics toward continuous analysis of runtime behavior. eBPF supports this evolution by exposing selected system-level signals that can be correlated with application performance, network activity, and security events.
One important direction is deeper integration with OpenTelemetry-based pipelines and existing monitoring platforms. Standardized telemetry formats and consistent resource attributes can help teams combine eBPF-derived signals with application-generated traces, metrics, and logs without requiring every signal to originate from the same instrumentation method.
Another direction is the convergence of observability and runtime security. The same system-level events that help engineers diagnose performance problems may also support detection of suspicious behavior. This creates opportunities for shared telemetry infrastructure, although performance and security teams still need distinct detection logic, access controls, and response procedures.
AI-assisted operations may further help by correlating large volumes of telemetry, identifying unusual patterns, and suggesting likely causes of incidents. Yet automated analysis is only as reliable as the data and context available to it. Teams should validate recommendations against observable evidence and avoid granting automated systems unrestricted control over production infrastructure.
The long-term value of eBPF will depend on how well organizations integrate it into their existing operational practices. The technology is most effective when it improves the quality of evidence available to engineers, rather than simply increasing the volume of collected data.
Conclusion: Making Distributed Systems More Observable –
Enterprise observability is becoming more challenging as organizations adopt microservices, Kubernetes, hybrid cloud infrastructure, and increasingly interconnected applications. Traditional metrics, logs, and traces remain essential, but they may leave gaps in understanding how operating-system behavior and network activity influence application performance.
eBPF provides a powerful way to collect selected runtime information from supported kernel and user-space instrumentation points. When combined with application tracing and infrastructure monitoring, it can help organizations investigate latency, understand service communication, monitor container workloads, and improve runtime security visibility.
However, eBPF is not a universal solution or a replacement for every observability tool. Its effectiveness depends on compatibility, security, instrumentation design, data correlation, and the ability to turn technical signals into actionable insights.
The strongest enterprise strategy is to start with clear observability gaps, deploy eBPF selectively, integrate the resulting data into existing workflows, and measure the operational value. As organizations pursue more reliable distributed systems, eBPF can provide an important missing layer between application symptoms and the underlying behavior of the infrastructure.
“Better observability is not about collecting every event. It is about uncovering the right evidence to understand why a system behaves the way it does.”
Frequently Asked Questions (FAQs) –
eBPF is a Linux technology that allows verified programs to run at supported kernel instrumentation points and collect or process selected runtime events. In observability, it helps teams examine system behavior, network activity, process execution, and other signals that complement application-level monitoring.
eBPF can add system-level context to distributed traces by exposing information about process activity, network connections, and selected runtime events. When the collected data can be correlated with application traces, engineers gain additional evidence for diagnosing latency and failures. It does not automatically provide complete business-level tracing for every application.
No. eBPF complements traditional monitoring tools by providing deeper visibility into selected operating-system and runtime behaviors. Application metrics, logs, distributed traces, infrastructure monitoring, and business-level telemetry remain important for understanding application behavior and customer impact.
Yes. eBPF-based tools are widely used for supported Linux workloads in Kubernetes environments to provide network visibility, runtime insights, and certain security capabilities. Organizations must validate kernel compatibility, permissions, and integration with their Kubernetes and observability platforms.
eBPF can be efficient, but instrumentation still consumes resources. Overhead depends on the number of probes, event frequency, program complexity, data processing, and telemetry export. Production deployments should be benchmarked and monitored under representative workloads.