



Introduction –
Modern enterprise applications are no longer built as a single application running on a single server. Organizations increasingly rely on microservices, containers, Kubernetes clusters, cloud platforms, service meshes, APIs, databases, message queues, and third-party services. While this architecture provides flexibility and scalability, it also creates a significant challenge: understanding what is actually happening inside the system.
Traditional monitoring approaches often struggle in these environments because they depend heavily on application-level instrumentation, agents, logs, and manually configured metrics. As applications become more distributed, the amount of telemetry generated can become overwhelming, while important system behavior may remain difficult to observe.
This is where eBPF and enterprise observability are becoming increasingly important. eBPF, which stands for Extended Berkeley Packet Filter, allows programs to run safely within the Linux kernel under strict verification and runtime controls. It can observe system and networking behavior with relatively low overhead and without requiring developers to modify every application to add instrumentation.
For enterprise organizations, this creates an opportunity to rethink observability. Instead of relying exclusively on what applications explicitly report, teams can gain visibility into what is actually happening at the infrastructure and kernel level. When combined with traditional logs, metrics, and traces, eBPF can provide a deeper and more continuous view of distributed systems.
What Is eBPF?
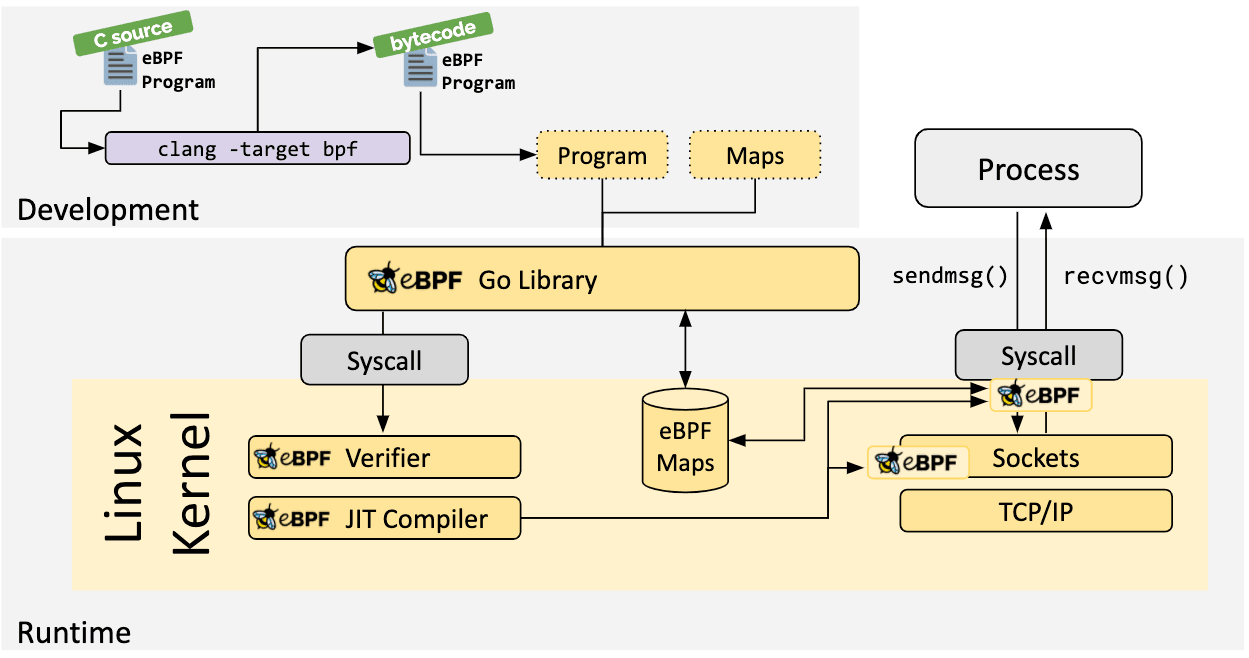
eBPF is a technology built into the Linux ecosystem that allows small, verified programs to execute in response to specific events within the kernel or other supported execution points.
Originally associated with packet filtering, eBPF has evolved into a general-purpose technology for observability, networking, security, performance analysis, and system tracing.
The important concept is that eBPF can observe activities such as system calls, network events, process execution, file operations, and other kernel-level behavior without requiring traditional kernel modifications.
This makes eBPF particularly interesting for modern enterprise environments where thousands of workloads may be running across physical servers, virtual machines, containers, and Kubernetes clusters.
Instead of asking every application to explain what it is doing, eBPF can observe parts of the underlying system directly.
Why Traditional Observability Is Becoming More Difficult –
Traditional observability is commonly built around three major telemetry categories: metrics, logs, and traces.
Metrics provide numerical measurements such as CPU utilization, memory consumption, request rates, and error rates. Logs provide detailed records of application or system events. Traces help organizations follow requests across distributed services.
These tools remain extremely valuable, but modern architectures create new challenges.
A single customer request may pass through an API gateway, authentication service, several microservices, a database, a cache, a message broker, and multiple external APIs before a response reaches the customer.
Each component can generate its own telemetry.
As the number of services increases, the volume and complexity of telemetry can grow dramatically. Teams may end up collecting enormous amounts of data while still struggling to answer relatively simple questions such as why a request became slow or which network dependency is responsible for an intermittent failure.
eBPF Changes the Observability Perspective –
The most significant advantage of eBPF is that it allows observability to move closer to the operating system and infrastructure layer.
Traditional application instrumentation generally requires developers or platform teams to explicitly add instrumentation to applications. This can be effective, but it takes time and requires consistent implementation across languages, frameworks, and services.
eBPF can observe certain behaviors from outside the application itself.
This creates an important distinction.
Application instrumentation asks applications to tell you what happened.
eBPF can observe aspects of what the system actually did.
That does not make eBPF a replacement for application instrumentation. Instead, it creates another layer of visibility that can complement existing observability systems.
eBPF and Enterprise Observability –
The combination of eBPF and enterprise observability is particularly powerful in distributed environments because organizations often operate workloads they did not completely design or instrument themselves.
These workloads may include third-party applications, legacy systems, containerized services, infrastructure components, and applications written in different programming languages.
Deploying traditional instrumentation across every component can be difficult.
eBPF can provide visibility into certain system and network behaviors without requiring teams to modify the source code of every workload.
For enterprises, this can make it easier to establish a consistent observability layer across heterogeneous environments.
Understanding Distributed Systems Through eBPF –
Distributed systems are difficult to understand because a single business transaction can cross many infrastructure boundaries.
Consider an online transaction.
A customer request might travel through:
User → CDN → Load Balancer → API Gateway → Authentication Service → Application Service → Database → Payment Service → External Provider
If the transaction takes three seconds instead of 300 milliseconds, the monitoring team needs to determine where the delay occurred.
Traditional tracing may provide the answer if every relevant component has been properly instrumented.
But if one service is missing instrumentation, or if the delay occurs in infrastructure or networking behavior that is not clearly represented in application traces, investigation becomes more difficult.
eBPF can provide additional information about processes, network connections, system calls, and other low-level activity.
This can help teams connect infrastructure behavior with application behavior.
The Role of eBPF in Network Observability –
Networking is one of the areas where eBPF has received significant attention.
Modern applications communicate constantly across networks. Containers communicate with other containers, services communicate across clusters, and workloads communicate with cloud services and external APIs.
Network-level problems can therefore create significant application-level problems.
Packet drops, connection failures, latency, retransmissions, DNS problems, and unexpected traffic patterns may affect application performance even when application metrics appear normal.
eBPF can observe network-related behavior at a lower level, providing telemetry that can help teams understand what is happening between workloads.
This is especially useful for Kubernetes environments, where service-to-service communication can become difficult to troubleshoot as cluster complexity increases.
eBPF and Kubernetes Observability –
Kubernetes has become a major platform for running distributed applications, but its flexibility comes with significant operational complexity.
A single Kubernetes cluster may contain hundreds or thousands of containers distributed across multiple nodes. Applications can scale dynamically, containers can be replaced automatically, and services can move between nodes.
This creates challenges for traditional monitoring.
An application that was running on one node five minutes ago may now be running somewhere else. Network paths may change. Containers may be created and destroyed rapidly.
eBPF can observe activity at the host and kernel level, allowing observability systems to follow certain behaviors even as workloads change.
This can be particularly valuable when combined with Kubernetes metadata, enabling teams to connect low-level events with higher-level concepts such as pods, namespaces, services, and workloads.
eBPF and Application Performance –
Application performance is not determined exclusively by application code.
A slow application can be affected by CPU scheduling, memory pressure, network latency, disk operations, system calls, database connections, or other infrastructure conditions.
Traditional application monitoring may identify that an API request is slow but provide limited information about why.
eBPF-based observability can provide additional context by examining lower-level system behavior.
For example, if an application becomes slow because of excessive system calls or network delays, kernel-level telemetry may help reveal the underlying behavior.
This creates a more complete picture of performance.
eBPF and Application Performance –
Application performance is not determined exclusively by application code.
A slow application can be affected by CPU scheduling, memory pressure, network latency, disk operations, system calls, database connections, or other infrastructure conditions.
Traditional application monitoring may identify that an API request is slow but provide limited information about why.
eBPF-based observability can provide additional context by examining lower-level system behavior.
For example, if an application becomes slow because of excessive system calls or network delays, kernel-level telemetry may help reveal the underlying behavior.
This creates a more complete picture of performance.
eBPF vs Traditional Application Instrumentation –
The comparison between eBPF and traditional instrumentation should not be treated as a competition.
Both approaches solve different problems.
Application instrumentation provides context that the operating system may not know.
For example, an application can explain:
- Which business transaction is being processed
- Which customer workflow is involved
- Which database query represents a specific business operation
- Which application feature generated the request
eBPF can provide information about:
- Processes
- System calls
- Network activity
- Kernel behavior
- Resource usage
- Connections
- Infrastructure interactions
The strongest observability architecture can combine these layers.
eBPF vs Application Instrumentation –
| Capability | eBPF | Application Instrumentation |
|---|---|---|
| Kernel visibility | Strong | Limited |
| Network visibility | Strong | Depends on instrumentation |
| Business context | Limited | Strong |
| Source-code changes | Often unnecessary | Usually required |
| Legacy application visibility | Useful | Often difficult |
| Distributed tracing context | Limited by itself | Strong |
| Infrastructure troubleshooting | Strong | Moderate |
| Application-specific details | Limited | Strong |
| Complementary to other telemetry | Yes | Yes |
eBPF and the Three Pillars of Observability –
The three traditional pillars of observability are metrics, logs, and traces.
eBPF can contribute information to all three areas.
For metrics, eBPF can help capture system and network measurements.
For tracing, eBPF can provide visibility into certain request and network flows.
For logs and events, eBPF-based tools can observe specific system activities and generate structured telemetry.
This makes eBPF less like another isolated monitoring tool and more like a mechanism for collecting telemetry from a different layer of the stack.
eBPF and Distributed Tracing –
Distributed tracing is essential for understanding request paths across microservices.
However, maintaining consistent instrumentation across dozens or hundreds of services can be challenging.
eBPF can complement distributed tracing by providing lower-level visibility into network and process relationships.
For example, an observability platform may be able to identify that one workload communicated with another even when traditional application tracing is incomplete.
This can help teams discover service dependencies and understand communication patterns.
However, eBPF alone generally cannot provide all the business context available through application-level traces.
The best results come from combining both approaches.
eBPF and Cloud-Native Architecture –
Cloud-native environments are highly dynamic.
Applications scale automatically, infrastructure is distributed, and workloads may be short-lived.
Traditional monitoring approaches were often designed around relatively stable infrastructure.
eBPF is well suited to dynamic environments because its observability can be attached to infrastructure behavior rather than depending entirely on static application configurations.
This can make it valuable for organizations operating Kubernetes, microservices, service meshes, and other cloud-native platforms.
Reducing Mean Time to Resolution –
One of the most important goals of enterprise observability is reducing Mean Time to Resolution (MTTR).
When an incident occurs, engineers need to answer several questions quickly:
What happened?
Where did it happen?
When did it start?
Which services are affected?
What changed?
What caused the problem?
How can we fix it?
eBPF can provide additional telemetry that helps answer these questions, particularly when problems involve networking, system resources, processes, or infrastructure behavior.
The result can be a shorter investigation process and faster incident resolution.
The Future of Enterprise Observability –
The future of observability is likely to become increasingly multi-layered.
Organizations will continue using application telemetry for business context, distributed tracing for request flows, infrastructure metrics for system health, and logs for detailed event analysis.
eBPF adds another layer by allowing teams to observe system and network behavior closer to where it actually happens.
As cloud-native environments become more complex, this deeper visibility may become increasingly important.
The most successful observability platforms will likely combine information from multiple layers and present it in a way that allows engineers to move from a business symptom to an application component and finally to the underlying infrastructure behavior.
“The future of observability is not simply collecting more telemetry. It is connecting the right telemetry across every layer of the system.”
Conclusion –
eBPF and enterprise observability represent an important evolution in how organizations understand distributed systems. As applications become increasingly distributed across containers, Kubernetes clusters, cloud platforms, and microservices, traditional application-level monitoring alone may not provide enough visibility.
eBPF offers a way to observe important system and network behaviors closer to the operating system. This can help organizations discover dependencies, investigate performance problems, understand network behavior, reduce observability blind spots, and improve incident response.
However, eBPF should not be viewed as a replacement for logs, metrics, traces, or application instrumentation. Its greatest value comes from complementing those technologies with deeper infrastructure-level visibility.
For enterprise IT teams, the opportunity is to build an observability architecture that connects application intent with infrastructure reality. When engineers can see not only what an application says happened but also how the underlying system behaved, troubleshooting distributed systems becomes more informed and potentially much faster.
As enterprise architectures continue to become more dynamic, eBPF may become an increasingly important foundation for understanding what is really happening inside modern distributed systems.